Agile
Agile Metrics in Practice #6: Principles for using metrics
Before jumping in to measuing your agile team, use these 12 principles to set-up your agile metrics practice for success.
Level up your agile game with these 8 key Agile Metrics. From velocity to business value, learn how to track and improve your team's performance in 2025.
Want to boost your team's performance and deliver maximum business value in 2025 and beyond? This listicle covers 8 key agile metrics every agile team should be tracking. Learn how metrics like Velocity, Sprint Burndown Charts, Lead Time, Cycle Time, Cumulative Flow Diagrams, Team Happiness, Escaped Defects, and Business Value Delivered provide actionable insights for data-driven decisions and continuous improvement. Whether you're using Scrum, Kanban, or a hybrid approach, these agile metrics will empower you to pinpoint strengths, weaknesses, and areas for optimization within your agile process. Let's get started.
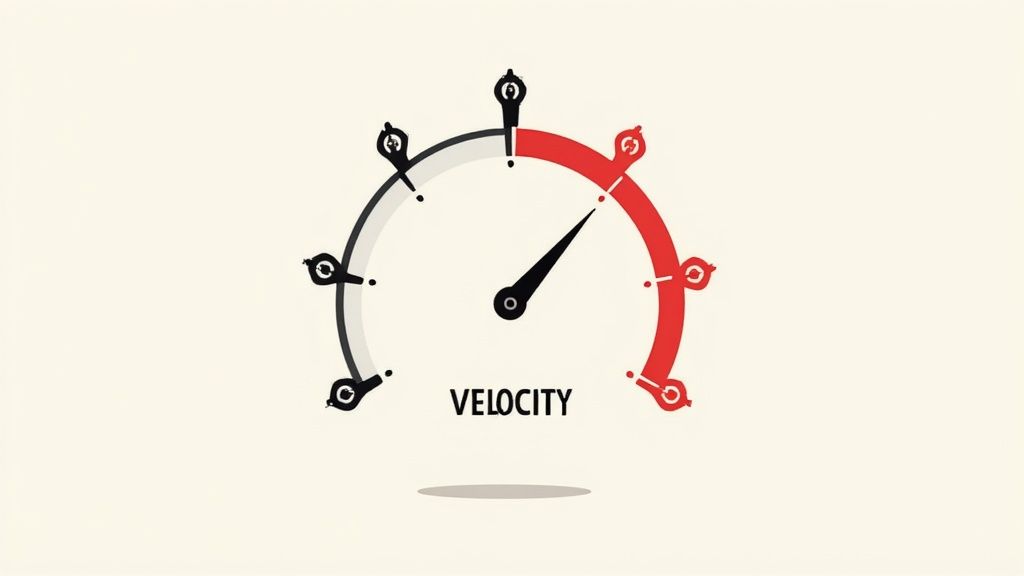
Velocity is a crucial agile metric that measures the amount of work a team can complete during a sprint. It provides a valuable snapshot of a team's productivity, not based on hours worked, but on the complexity of tasks completed. Instead of focusing on time, velocity typically uses story points, ideal days, or other abstract units to represent the size of work items. By tracking velocity over multiple sprints, teams can refine their estimation process, plan future work more effectively, and make project timelines more predictable, ultimately leading to improved delivery consistency. This makes it a cornerstone of successful agile project management.
Velocity is calculated by summing the story points assigned to all fully completed stories within a sprint. This simple calculation, tracked and graphed over time, reveals trends in team output and helps identify potential bottlenecks. While individual sprint velocity can fluctuate, observing the trend over several sprints offers a more stabilized view of the team's capacity. This data empowers the team to make more realistic commitments for future sprints and enhances their long-term planning and forecasting capabilities. For instance, if a team's average velocity is 40 story points over the last three sprints, they can confidently commit to a similar workload for the next sprint.
Features and Benefits:
Pros and Cons of Using Velocity:
Pros:
Cons:
Examples of Successful Implementation:
Actionable Tips for Using Velocity:
Popularized By:
Velocity as a metric has been popularized by influential figures and frameworks within the agile community, including Mike Cohn (author of Agile Estimating and Planning), the Scrum Alliance, and the Scaled Agile Framework (SAFe). Its widespread adoption underscores its importance in agile project management.
The Sprint Burndown Chart is a crucial agile metric providing a clear visual representation of the work remaining versus the time left in a sprint. It tracks the rate at which story points, tasks, or hours are completed – effectively showing how work is "burned down" – and offers a quick way to assess if the team is on track to meet its sprint goals. The chart plots remaining work on the Y-axis against the days of the sprint on the X-axis. An "ideal" burndown line, representing a consistent completion rate, is often included for comparison, although real-world progress typically fluctuates around this ideal line.
The Sprint Burndown Chart deserves a prominent place in any discussion of agile metrics due to its ability to provide immediate, easily digestible feedback on sprint progress. This visual nature makes it a powerful communication tool for everyone involved, from developers to stakeholders. Features such as the daily update frequency, the clear depiction of remaining work, and the inclusion of an ideal reference line contribute to its effectiveness. Organizations like Atlassian, renowned for their agile practices, leverage digital burndown charts within Jira, while even traditional manufacturing giants like Toyota have found value in using physical burndown charts on their team boards. These examples highlight the wide applicability of this agile metric.
Pros:
Cons:
Tips for Effective Use:
When and Why to Use:
The Sprint Burndown Chart is an invaluable tool throughout the sprint cycle, providing a constant pulse on progress and potential issues. It's particularly beneficial for:
Popularized by Scrum co-creators Ken Schwaber and Jeff Sutherland, and integrated into popular tools like Atlassian Jira, the Sprint Burndown Chart remains a fundamental agile metric for achieving transparency and promoting effective teamwork. It is a powerful asset for any team striving to optimize their agile workflows and deliver successful projects.
Lead Time is a crucial agile metric that measures the total time elapsed from the moment a work item (like a user story, bug fix, or feature request) is requested to the moment it's delivered to the customer or end-user. This end-to-end measurement provides valuable insight into the overall efficiency of your delivery process, allowing teams to understand how long it truly takes to convert ideas into tangible value. Its focus on the entire timeline, from request to delivery, is why it deserves a prominent place in the list of essential agile metrics. It's a powerful tool for optimizing workflows, identifying bottlenecks, and ultimately, delivering value faster.
Lead Time is typically measured in days or weeks and provides a holistic view of your team's performance. Unlike cycle time, which only measures the time spent actively working on an item, Lead Time encompasses both active work time and waiting time. This provides a more realistic representation of the customer's experience. For example, a feature might be actively worked on for only a few days, but if it sits in a queue for weeks waiting for dependencies to be resolved, the Lead Time will reflect that delay, highlighting potential areas for improvement. This customer-centric perspective aligns Lead Time directly with business outcomes, making it a valuable metric for both technical teams and business stakeholders.
Features and Benefits:
Pros:
Cons:
Examples of Successful Implementation:
Actionable Tips for Using Lead Time:
When and Why to Use Lead Time:
Lead Time is particularly valuable for teams practicing agile methodologies like Kanban or Scrum, where a focus on continuous flow and rapid delivery is paramount. It’s relevant for any team involved in delivering value to customers, including software development, marketing, and operations. Use Lead Time when you want to:
Popularized By:
The concept of Lead Time in the context of agile development has been significantly influenced by thought leaders such as David J. Anderson, the creator of the Kanban Method, and Donald Reinertsen, author of "The Principles of Product Development Flow." Kanban University also promotes the use of Lead Time as a key metric for optimizing workflows.
Cycle Time is a crucial agile metric that measures the time it takes a team to complete a work item, from the moment work begins until it's finished. Unlike Lead Time, which considers the entire time an item spends from request to completion, Cycle Time focuses solely on the active development period. This distinction makes it a powerful indicator of team efficiency and process health, as it filters out wait times and focuses purely on how effectively the team delivers value. For teams aiming to optimize their agile processes, understanding and tracking Cycle Time is essential. This metric earns its place on our list of essential agile metrics because it offers valuable insight into a team's internal workflow and identifies areas ripe for improvement.
How Cycle Time Works:
Cycle Time is measured from the moment a work item is actively started until it's deemed "done." This "done" state typically aligns with the team's definition of ready for release or delivery. This could be when a feature is fully developed and tested, a bug is fixed and verified, or a user story is completed and accepted. Cycle time is usually calculated in days or hours and can be tracked individually for each work item to identify variations and then averaged to understand overall team performance. It's often visually represented on Cumulative Flow Diagrams or control charts to track trends and identify anomalies.
Features and Benefits:
Pros:
Cons:
Examples of Successful Implementation:
Actionable Tips for Improving Cycle Time:
When and Why to Use Cycle Time:
Cycle Time is particularly valuable for teams looking to:
By focusing on Cycle Time, teams can gain valuable insights into their performance and drive continuous improvement within their agile development process. This metric empowers teams to work smarter, not harder, and deliver value more efficiently to their customers.
The Cumulative Flow Diagram (CFD) stands out as a powerful agile metric for visualizing and analyzing workflow. It provides a dynamic, at-a-glance view of work items as they progress through various stages of your development process. Unlike metrics that focus on individual sprints or cycles, the CFD illustrates the overall flow of work over time, making it particularly valuable for teams practicing Kanban and other continuous flow methodologies. It helps identify bottlenecks, optimize Work in Progress (WIP), and ultimately improve delivery predictability.
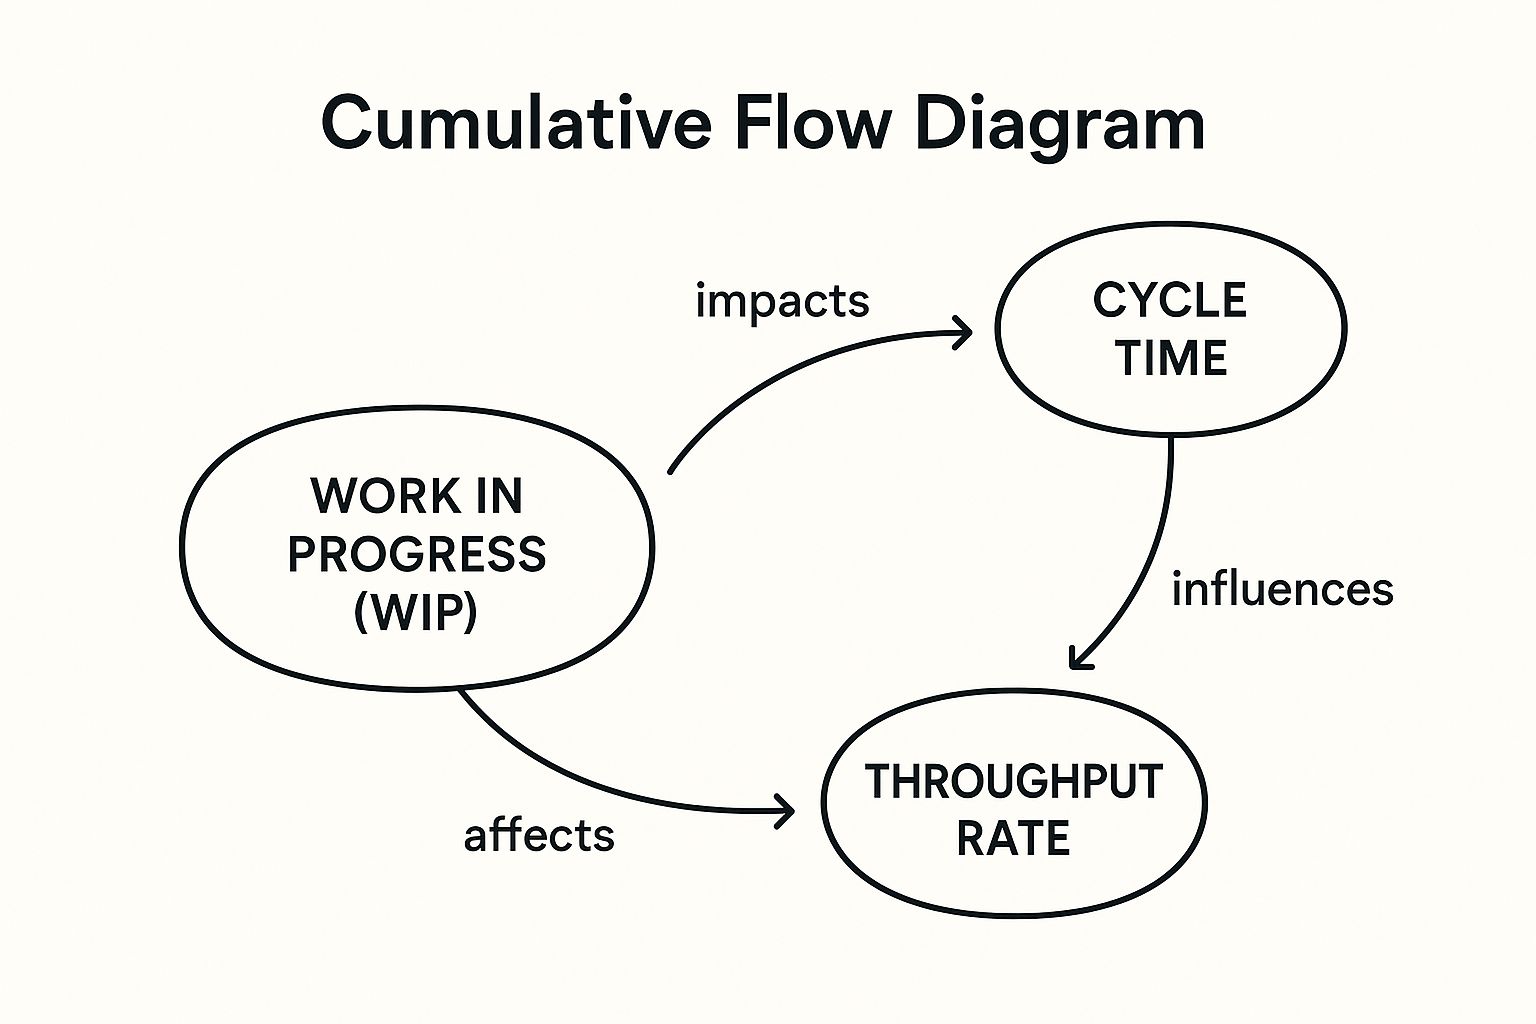
The infographic visualizes the core concepts of a CFD. The central concept is "Cumulative Flow Diagram" itself. Related concepts include "Work Items," "Workflow Stages" (e.g., To Do, In Progress, Done), "Time," and "Cumulative Count." "Work Items" flow through the "Workflow Stages" over "Time," and the "Cumulative Count" for each stage is represented by the vertical height of its respective band. The most crucial relationship highlighted is the changing width of each band over time, indicating WIP and potential bottlenecks. As seen in the image, widening bands signal accumulating work within a stage, suggesting a bottleneck. Conversely, parallel bands indicate a smooth flow.
The CFD's strength lies in its ability to reveal patterns and trends in your workflow that might otherwise remain hidden. By tracking the number of work items in each stage over time, the CFD visually represents work distribution, arrival rates, completion rates, and WIP at any given moment. This allows teams to readily identify bottlenecks, depicted as widening bands on the diagram, and proactively address them. For instance, if the "In Progress" band expands significantly while the "Done" band remains relatively flat, it signals a bottleneck in the development process.
Features and Benefits:
Pros:
Cons:
Examples of Successful Implementation:
Organizations like Siemens Health Services and Capital One leverage CFDs to gain valuable insights into their workflows. Siemens utilizes CFDs to monitor flow and identify process improvement opportunities, while Capital One's digital product teams employ CFDs to effectively manage their Kanban systems. These examples demonstrate the practical application and benefits of CFDs in diverse organizational settings.
Tips for Effective Use:
Popularized By:
The CFD’s value within agile metrics comes from its ability to provide a holistic view of the entire flow, enabling teams to address systemic issues and optimize the delivery process continuously. For teams aiming for continuous improvement and efficient flow management, especially those using Kanban, the CFD is an indispensable tool.
Team Happiness/Satisfaction, a crucial agile metric, measures how team members feel about their work environment, processes, and collaboration. It provides valuable insights into team morale, engagement, and the potential for burnout. In agile environments, high team satisfaction is strongly correlated with sustained productivity, lower turnover rates, and improved quality outcomes. Unlike metrics focused solely on output, Team Happiness/Satisfaction delves into the human aspect of software development, recognizing that motivated and engaged teams deliver better results. This qualitative metric is typically collected through regular surveys or during retrospectives.
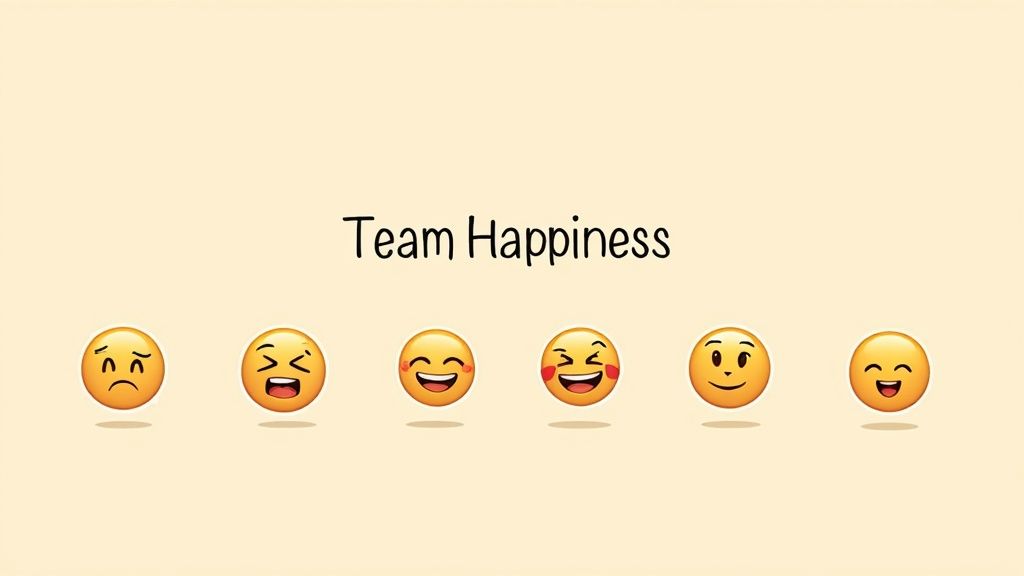
This metric is typically measured using numerical scales (e.g., 1-5 or 1-10) and can incorporate both quantitative ratings and qualitative feedback. Data collection usually occurs at regular intervals, such as sprint-based or monthly, and can cover various dimensions like work-life balance, team dynamics, tools used, and the effectiveness of agile processes. This allows for a comprehensive understanding of what contributes to or detracts from team satisfaction.
Features:
Pros:
Cons:
Examples of Successful Implementation:
Tips for Effective Use:
When and Why to Use This Approach:
Team Happiness/Satisfaction should be a regular component of any agile team's process. It's particularly valuable when:
Team Happiness/Satisfaction earns its place in the list of essential agile metrics because it bridges the gap between human dynamics and project outcomes. By focusing on the well-being of the team, organizations can foster a more productive, engaged, and ultimately successful agile environment. This metric, championed by figures like Henrik Kniberg (Spotify), Jurgen Appelo (Management 3.0), and Simon Sinek (psychological safety), has become increasingly recognized as a critical element for thriving agile teams.
Escaped Defects, a crucial agile metric, measures the number of bugs or software defects discovered after a feature or product has been released to production and is in the hands of users. It serves as a direct indicator of the effectiveness of a team's quality assurance (QA) practices, testing processes, and ultimately, the overall quality delivered to the customer. Tracking and analyzing this metric provides valuable insights into areas for improvement within the development lifecycle.
How Escaped Defects Works:
This metric focuses on bugs found after a feature is deemed "done" and deployed. These defects are often categorized by severity (critical, major, minor) to understand their impact on the user experience. To provide a more meaningful analysis, the raw number of escaped defects can be normalized by factors such as story points or the number of features delivered. Tracking the trend of escaped defects over time is essential to assess the long-term impact of quality initiatives.
Why Escaped Defects Matter in Agile:
In the fast-paced world of agile development, maintaining high quality is paramount. Escaped Defects deserves its place on the list of essential agile metrics because it directly reflects the customer experience. By minimizing escaped defects, teams can enhance customer satisfaction, build trust, and reduce the costs associated with fixing issues in production. This metric also fosters accountability for quality throughout the entire development process, encouraging a proactive approach to defect prevention.
Features and Benefits of Tracking Escaped Defects:
Pros:
Cons:
Examples of Successful Implementation:
Actionable Tips for Tracking and Reducing Escaped Defects:
When and Why to Use Escaped Defects:
This metric is particularly valuable for teams practicing continuous integration and continuous delivery (CI/CD), where frequent releases make early defect detection crucial. It is also highly relevant for teams developing customer-facing applications or software with high-quality requirements.
Popularized By:
The concept of tracking escaped defects has been popularized by various methodologies and movements, including:
By effectively tracking and analyzing Escaped Defects, agile teams can continuously improve their quality practices, deliver higher-value products, and enhance customer satisfaction. This metric serves as a vital feedback loop, driving continuous improvement and reinforcing a culture of quality throughout the development process.
Business Value Delivered is a crucial agile metric that goes beyond simply measuring output (e.g., number of story points completed) and focuses on the actual impact of delivered features on the business. It answers the question: "What tangible benefits did our work deliver to the customer, market, or our bottom line?" This outcome-oriented approach is essential for maximizing the return on investment (ROI) of agile development and ensuring alignment between development efforts and overall organizational goals. This metric deserves its place on this list because it shifts the focus from activity to impact, a key principle of successful agile implementations.
How it Works:
Business Value Delivered connects the technical deliverables of agile teams to quantifiable business outcomes. Instead of just tracking velocity or sprint burndown, this metric uses key performance indicators (KPIs) tied directly to business goals. These KPIs can be financial (e.g., revenue increase, cost savings), customer-centric (e.g., user adoption rate, customer satisfaction scores, Net Promoter Score), or operational (e.g., improved process efficiency, reduced error rates). It quantifies the impact of features and improvements on these metrics, demonstrating the real-world value of the development team's work.
Examples of Successful Implementation:
Actionable Tips for Implementation:
When and Why to Use This Approach:
Business Value Delivered is particularly relevant when:
Pros:
Cons:
Popularized By:
By focusing on Business Value Delivered as a key agile metric, organizations can ensure that their development efforts are truly aligned with business objectives and deliver maximum impact. This shift towards outcome-driven development is crucial for success in today's competitive market.
| Metric | Implementation Complexity 🔄 | Resource Requirements ⚡ | Expected Outcomes 📊 | Ideal Use Cases 💡 | Key Advantages ⭐ |
|---|---|---|---|---|---|
| Velocity | Low – simple to calculate from completed work | Low – uses existing sprint data | Predictable sprint planning, team capacity visibility | Sprint-based teams needing forecasting | Easy to understand; supports realistic commitments |
| Sprint Burndown Chart | Medium – requires daily updates and tracking | Medium – needs frequent data input | Real-time sprint progress visualization; early impediment detection | Teams practicing Scrum needing daily progress tracking | Immediate feedback; highlights scope creep |
| Lead Time | Medium – requires tracking start to delivery | Medium – tracking across whole workflow | Overall delivery efficiency insight; bottleneck identification | Kanban or continuous flow teams focused on end-to-end time | Aligns with customer delivery; monitors process health |
| Cycle Time | Medium – tracks active work phases only | Medium – requires accurate start/end points | Team efficiency measurement; process bottleneck detection | Teams optimizing active work duration | Directly reflects team efficiency; easier to improve |
| Cumulative Flow Diagram | High – complex data visualization and interpretation | Medium-High – needs consistent state tracking | Visualizes work states, bottlenecks, and flow health | Kanban teams monitoring flow and WIP | Rich flow insights; bottlenecks clearly visible |
| Team Happiness/ Satisfaction | Low – uses surveys or qualitative methods | Low – periodic survey tools | Measures team morale, engagement, risk of burnout | Agile teams focused on culture and psychological safety | Early warning for productivity issues; promotes transparency |
| Escaped Defects | Medium – requires defect tracking post-release | Medium – defect categorization and analysis | Quality feedback; identifies QA gaps | Teams emphasizing product quality and customer satisfaction | Links quality issues to improvements; accountability boost |
| Business Value Delivered | High – complex attribution to business metrics | High – needs additional measurement systems | Demonstrates impact on business outcomes and ROI | Organizations focusing on outcome-driven delivery | Connects work to business impact; aids prioritization |
Choosing the right agile metrics and integrating them into your workflow is a crucial step towards achieving true agility. From understanding your team's velocity and tracking sprint burndown, to minimizing lead and cycle times, the agile metrics discussed in this article—velocity, sprint burndown charts, lead time, cycle time, cumulative flow diagrams, team happiness/satisfaction, escaped defects, and business value delivered—provide a comprehensive toolkit for optimizing your development process. Remember that these metrics aren't just about tracking numbers; they're about gaining valuable insights that drive positive change. By effectively leveraging agile metrics, you can identify bottlenecks, improve predictability, boost team morale, and ultimately deliver more value to your customers.
Mastering these concepts is invaluable for anyone involved in an agile environment, from engineering managers and scrum masters to product owners and CTOs. The ability to interpret and act upon these metrics empowers teams to continuously improve, adapt to change more effectively, and achieve higher levels of performance. This translates to not just better software, but a more efficient, engaged, and successful organization overall. By regularly reviewing these metrics and adapting your approach, you can empower your agile teams to reach new heights of productivity, predictability, and success.
Ready to unlock the full potential of your agile metrics? Umano provides comprehensive, real-time agile metrics integrated with your existing tools, allowing you to gain deeper insights into your team's performance and identify areas for improvement. Visit Umano today and discover how you can leverage the power of data to drive agile success.
Before jumping in to measuing your agile team, use these 12 principles to set-up your agile metrics practice for success.
Get intentional about making the agile principles living and breathing truths in your team by applying a system of measurement with related agile...
Your agile practices will generate a rich dataset captured automatically by your tools of their own accord. The key is to use the same tools,...