Decoding Agile Cycle Time: Why It Makes or Breaks Teams
In the world of Agile development, many teams emphasize velocity, or the amount of work completed per sprint. However, agile cycle time offers a more insightful look at the health of a team's delivery pipeline. This metric measures the time it takes to complete a task, from beginning to end. Optimizing this metric can significantly boost a team's efficiency and overall success.
Understanding Agile Cycle Time
Agile cycle time differs from lead time. Lead time measures the total time from customer request to delivery. Cycle time, conversely, focuses only on the execution phase. For example, if a user story takes two days to move from development start to deployment, its cycle time is two days. Lead time would include any time spent in the backlog before development began. This distinction makes cycle time valuable for identifying bottlenecks within development.
Why Cycle Time Matters
Reducing cycle time is a crucial way to create a competitive advantage. Teams that deliver value to customers quickly can respond to market changes and iterate on products with more agility. High-performing teams prioritize cycle time optimization as a key performance indicator (KPI). They recognize its link to customer satisfaction, team morale, and business success. Shorter cycle times also create more frequent feedback opportunities, leading to continuous improvement.
Focusing on cycle time fosters a culture of efficiency. By tracking and analyzing this metric, teams pinpoint areas for improvement in their workflows. This could involve streamlining communication, automating repetitive tasks, or enhancing team collaboration. These improvements create a more productive and effective development process. While comprehensive historical data on Agile cycle time is limited, current adoption metrics emphasize its significance. Organizations using cycle time tracking often see 20-40% efficiency gains within six months. Learn more about cycle time statistics: Agile Cycle Time Statistics
The Impact of Cycle Time
Cycle time signifies more than just speed. It's a key indicator of overall team health and efficiency. A consistently short cycle time often suggests streamlined processes, strong collaboration, and a solid grasp of the work. Conversely, a lengthy or unpredictable cycle time may indicate underlying issues. These issues could include unclear requirements, inefficient workflows, or communication breakdowns. Monitoring cycle time provides teams with insight into their performance and helps them identify areas for improvement.
By understanding and managing agile cycle time, teams can unlock their potential and deliver value more efficiently. This focus empowers teams to not only meet, but exceed expectations, leading to greater success in the world of software development.
The Evolution of Cycle Time: From Factory Floors to Software Teams
The concept of cycle time, the time it takes to complete a process from beginning to end, wasn't born in the software world. Its origins trace back to manufacturing, particularly with the renowned Toyota Production System. This system prioritized efficiency and minimizing waste, with cycle time as a core performance metric.
This emphasis on optimizing production flow proved remarkably influential, shaping the later development of Agile methodologies.
The Influence of Lean Manufacturing
Toyota's focus on minimizing waste and maximizing flow, known as Lean Manufacturing, became a key inspiration for software development. This influence is clear in the principles of Agile, which similarly prioritize efficient processes and rapid delivery. Adapting cycle time from manufacturing provided a concrete metric for software teams to track progress and identify bottlenecks.
This adoption paved the way for more efficient software development practices.
Kanban and the Standardization of Cycle Time
The integration of Kanban into Agile in the late 2000s solidified cycle time's importance. Kanban, a visual workflow management system, provided a structure for tracking work items and measuring their cycle time. This led to standardized cycle time measurement, giving teams a deeper understanding of their development process. After this Kanban integration, cycle time measurement became standard practice.
Toyota's manufacturing cycle times inspired tech adaptations where cycle time optimization now drives a 15-30% reduction in time-to-market for SaaS products. While precise historical data isn't readily available, modern case studies show healthcare tech teams achieving 5-day cycle times for compliance features, compared to 3-week averages with waterfall approaches. Manufacturing-inspired WIP limits (work-in-progress), a major influence on cycle time, usually keep teams at 2-3 active items per developer. Organizations using WIP limits report 40% fewer bottlenecks. The 2022 Accelerate State of DevOps report links elite performers with cycle times under 24 hours, although our focus here is on methodology rather than specific statistics. Explore more about Agile Software Development.
Cycle Time in the Modern Agile Landscape
Cycle time remains a relevant and valuable metric even as Agile continues to evolve. With the rise of CI/CD pipelines and DevOps, tracking cycle time has become even more crucial. These practices emphasize automation and continuous delivery, making cycle time a key indicator of overall efficiency. Monitoring cycle time allows teams to identify areas for improvement and further refine their delivery processes.
Real-World Examples
Many organizations have successfully applied manufacturing efficiency principles to software delivery, using cycle time as a guiding metric. For example, some companies implement WIP limits, inspired by manufacturing, to reduce bottlenecks and improve flow. Others use cycle time data to pinpoint and address process inefficiencies. These practical examples demonstrate the tangible benefits of using cycle time to enhance software development.
Umano, in particular, gives teams real-time data to optimize cycle time and reach peak performance. By tracking cycle time and other key metrics, Umano helps teams uncover hidden bottlenecks and refine their delivery process. Learn more at Umano about how we can help your team achieve its Agile goals.
Measuring What Matters: Cycle Time Tracking That Actually Works
Forget vanity metrics. Let's talk about practical ways to measure agile cycle time that give you useful information. This means knowing when to start and stop tracking time, which tasks to monitor, and how to handle unexpected issues without messing up your data.
Defining Your Cycle Time Starting and Stopping Points
Getting the start and end times right is super important for accurate cycle time tracking. Usually, the clock starts when work actively begins on a task. This could be when a developer picks up a task from the backlog, or when a story moves to "In Progress" on your Jira board. The cycle ends when the task is completely finished—tested, accepted, and maybe even deployed. This consistency makes sure your data shows the actual work effort.
Selecting the Right Items to Track
Tracking every single tiny task might seem like a good idea, but it can be too much information. It's better to focus on tracking tasks that represent a meaningful amount of work, like user stories, features, or bug fixes. This gives you a better overall understanding of your development process. Tracking the cycle time for every line of code isn't as helpful as tracking the time for a whole user story.
Handling Exceptions and Roadblocks
Things don't always go as planned. Interruptions, waiting on other teams, or unexpected problems can affect cycle time data. You need to account for these hiccups. You could pause the clock when a task is blocked and restart it when work continues. Another option is to categorize and analyze the reasons for delays to find and fix recurring bottlenecks.
Tools for Efficient Cycle Time Tracking
Turning cycle time tracking from a chore into an automated system is possible with the right tools. Simple Kanban boards give you a visual overview of your workflow and allow for basic cycle time calculations. Advanced analytics dashboards can integrate with project management software, automatically calculating cycle time and offering deeper data analysis.
Complementary Metrics for Context
Cycle time is a great metric, but it's even better when combined with other metrics. Lead time, the total time from request to delivery, helps you understand customer wait times. Throughput, the amount of work completed in a certain time, shows your team's overall output. Together, these metrics give a more complete picture of your team's performance.
Establishing Baselines and Interpreting Trends
To know if your cycle time is good or bad, you need a baseline. This is the average cycle time for your team, based on their current work and processes. Track cycle time over several sprints to spot trends. A downward trend is good, while an upward trend might signal bottlenecks or problems in your process.
To illustrate these trends, let's examine the data in the following chart. The following bar chart visualizes the average cycle time for different types of work items over a three-month period:
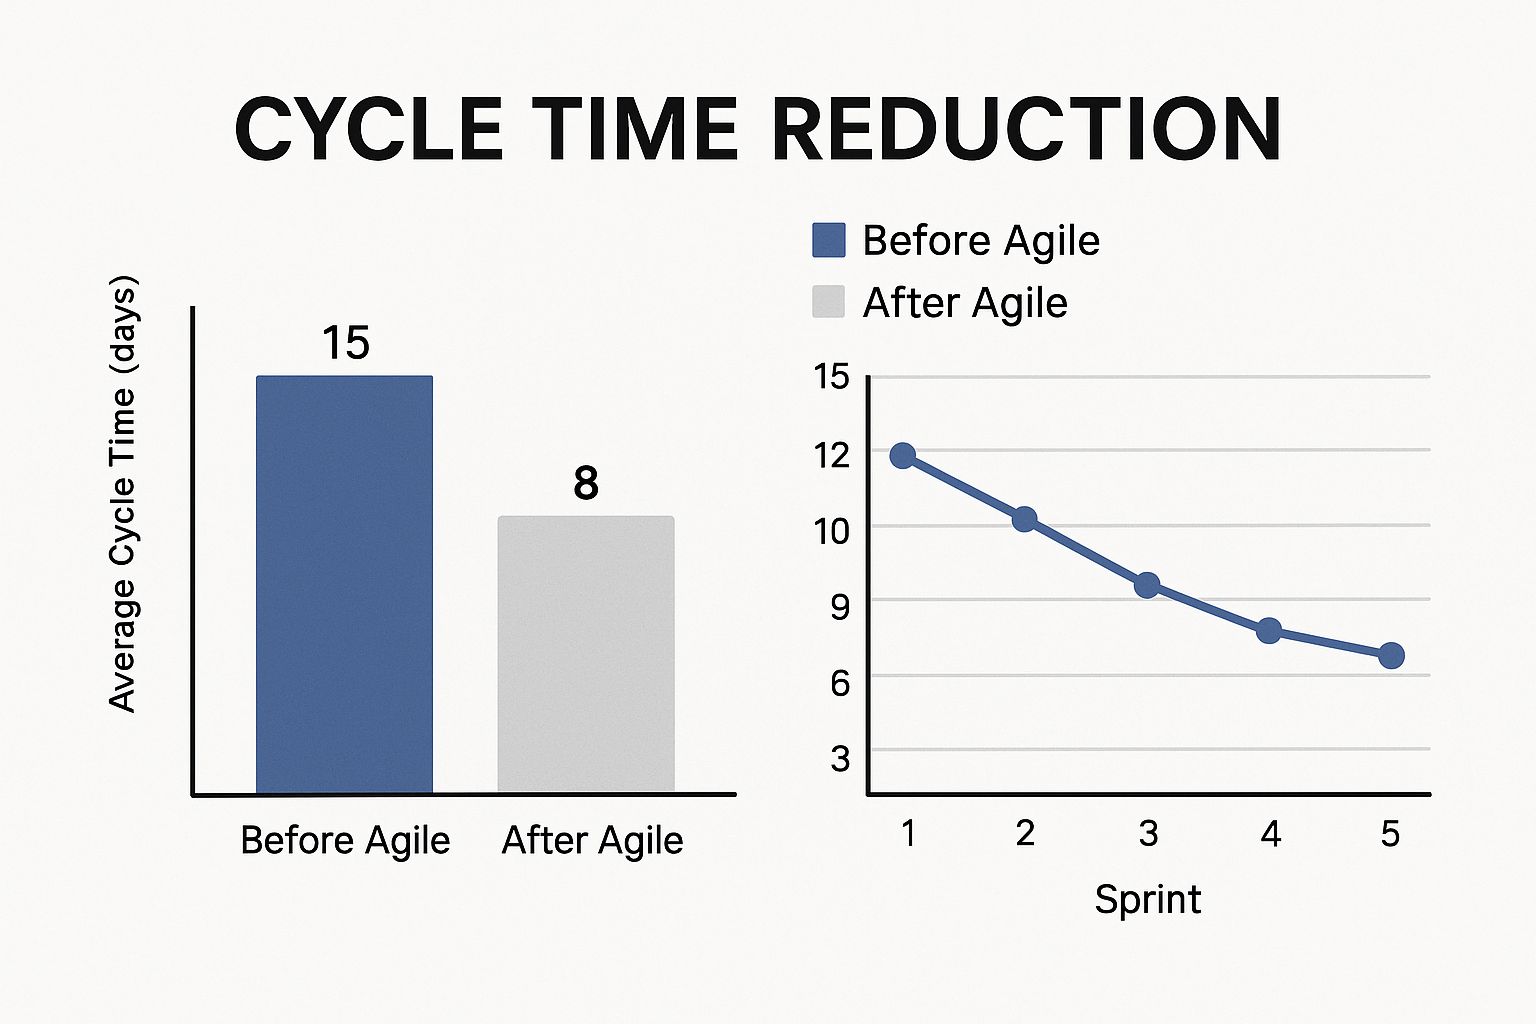
As you can see, Bug Fixes initially took the longest, averaging 10 days. Over three months, this dropped to 5 days, a positive sign. New Features went from 7 days to 9 days, suggesting potential issues in feature development. User Stories stayed steady at 6 days. This chart helps teams quickly identify areas for improvement.
To help teams track and improve cycle time, consider the following comparison of popular Agile tools:
Agile Cycle Time Measurement Tools Comparison: This table compares popular tools and platforms for tracking cycle time in Agile teams.
| Tool |
Key Features |
Best For |
Integration Capabilities |
Price Range |
| Jira |
Customizable workflows, reporting, and integrations |
Teams of all sizes |
Integrates with various development tools |
Varies based on team size and features |
| GitLab |
Built-in CI/CD, issue tracking, and code review |
DevOps teams |
Strong integration with Git repositories |
Free and paid plans |
| GitHub |
Version control, project management, and collaboration tools |
Open-source projects and teams |
Wide range of integrations |
Free and paid plans |
| Azure DevOps |
Comprehensive DevOps platform with CI/CD, testing, and deployment tools |
Enterprise-level teams |
Integrates with other Azure services |
Varies based on usage and features |
| Trello |
Simple Kanban boards for visualizing workflow and tracking progress |
Small to medium-sized teams |
Integrates with various productivity tools |
Free and paid plans |
This table highlights some popular options, and selecting the right tool depends on your specific team needs and budget.
By understanding these parts of cycle time tracking, teams gain valuable insight into their Agile processes. Umano offers a complete platform for measuring and analyzing cycle time and other key metrics, helping teams optimize their performance. Learn more about how Umano can benefit your team at Umano.
Beyond the Numbers: What Your Cycle Time Reveals Globally
Agile cycle time is more than just a metric; it offers valuable insights into organizational culture, team dynamics, and even market positioning. Examining global trends reveals surprising factors that influence cycle time beyond simple process design. This means similar teams can achieve vastly different results based on influences beyond their chosen processes. Let's explore these often-overlooked factors.
Cultural Context and Its Impact
Cultural context significantly impacts how teams approach work and, consequently, their cycle times. Some cultures prioritize individual contributions, while others emphasize collaboration. This affects communication, decision-making speed, and how quickly work progresses. Cultural norms around work-life balance also play a role. Teams with stricter boundaries may have longer cycle times but experience less burnout. These nuances significantly affect team productivity and well-being.
Tooling Investments and Their Significance
Investing in the right tools can be transformative for agile cycle time. Automated testing, robust CI/CD pipelines, and sophisticated project management platforms dramatically reduce manual work and streamline workflows. Teams with better tooling often complete work much faster. However, simply possessing these tools isn't enough. Effective training is crucial for teams to realize the full potential of their tools. Investing in both the tools and training is key.
Global adoption patterns highlight these points. While precise figures are hard to obtain due to inconsistent reporting, clear trends emerge. US tech hubs often prioritize cycle time more aggressively than emerging markets. Tooling investments are a key differentiator, with established tech centers often deploying resources that boost cycle time, according to industry analysts. For a deeper dive into agile cycle time trends, explore this resource: Discover more insights about agile cycle time.
Leadership Approaches and Their Influence
Leadership significantly shapes team culture and drives cycle time performance. Leaders who prioritize psychological safety and empower teams often see faster cycle times. This supportive environment fosters collaboration, reduces fear of failure, and allows for rapid experimentation and iteration. Conversely, micromanagement and top-down decision-making can hinder innovation and slow down the entire cycle. Leadership style significantly shapes team dynamics and efficiency.
Realistic Benchmarks Across Industries
Understanding what constitutes a "good" cycle time for your specific industry and team size is crucial for setting realistic goals. Software development teams, for example, might aim for cycle times of a few days for smaller features, while manufacturing teams might measure cycle times in hours. Healthcare technology, with its strict regulatory requirements, often has longer cycle times due to necessary compliance checks. Industry benchmarks provide valuable context for assessing performance and identifying areas for improvement.
By considering these global perspectives and industry benchmarks, teams can gain a more nuanced understanding of agile cycle time and its influence on performance. Umano provides tools and insights to optimize cycle time, leading to greater efficiency and improved business outcomes. Learn more about how Umano can support your team at Umano.
Breaking the Bottlenecks: Proven Cycle Time Optimization Tactics

Let's move from theory to practice and explore how to actually improve agile cycle time. We'll examine proven methods like limiting work-in-progress, effectively breaking down tasks, and using data analysis to pinpoint process bottlenecks. These techniques have helped teams achieve real improvements.
Implementing WIP Limits to Reduce Multitasking
One of the most effective cycle time optimization strategies is implementing Work-in-Progress (WIP) limits. This means setting a cap on the number of tasks a team or individual handles at once. This seemingly small adjustment can have a significant impact.
Think of a busy highway: adding more cars (tasks) to an already congested road only slows things down further. By limiting WIP, teams can concentrate on completing existing tasks before starting new ones, leading to a smoother, faster workflow.
Right-Sizing Tasks for Optimal Flow
Right-sizing tasks is another crucial tactic. Large, complex tasks can obstruct progress and significantly lengthen cycle time. Breaking these down into smaller, more manageable units allows for steady progress and quicker completion.
Imagine trying to eat an entire cake in one bite! Slicing it into manageable pieces makes it much easier. Similarly, smaller tasks are easier to handle and finish, reducing the overall cycle time.
Identifying Bottlenecks Through Data Analysis
Data analysis is essential for cycle time optimization. By tracking cycle time for various tasks and workflow stages, teams can identify bottlenecks—points where work slows down or piles up.
Once these bottlenecks are identified, teams can implement targeted solutions. This data-driven approach ensures continuous improvement and maintains a smooth development process.
Leveraging Automation and Continuous Integration
Automated testing and Continuous Integration (CI) are vital for optimizing cycle time. Automated tests, using tools like Selenium, reduce manual testing time, catch errors early, and prevent rework. CI facilitates frequent code integration, enabling faster feedback loops and preventing integration conflicts that delay progress. This promotes rapid iterations and faster value delivery.
Addressing Common Challenges
Optimizing agile cycle time isn't always straightforward. Teams frequently encounter challenges such as dependencies on other teams, unexpected interruptions, and unclear requirements.
However, proactive communication, clear priority setting, and flexible planning can mitigate these issues. This involves establishing clear communication channels with other teams, building buffer time for unforeseen tasks, and thoroughly defining requirements before starting work.
Case Studies and Real-World Examples
Numerous organizations have successfully reduced their cycle times by implementing these tactics. Some have seen reductions of 20-40% or more. For example, one team reduced their average cycle time from two weeks to three days by implementing WIP limits and breaking down tasks. Another team cut their testing time by 50% through automated testing and CI.
To understand these common roadblocks and their solutions, let’s review the following table:
The table below identifies common workflow obstacles that increase cycle time and outlines effective solutions to address them.
Common Cycle Time Bottlenecks and Solutions
| Bottleneck |
Impact on Cycle Time |
Root Causes |
Solution Strategies |
Expected Improvement |
| Unclear Requirements |
Increases |
Poor communication, incomplete documentation |
Clarify requirements upfront, involve stakeholders early |
10-20% reduction |
| Too Many Work Items in Progress |
Increases |
Lack of WIP limits, multitasking |
Implement WIP limits, focus on finishing tasks |
20-40% reduction |
| Inefficient Testing Processes |
Increases |
Manual testing, slow feedback loops |
Automate testing, implement CI |
30-50% reduction |
| Dependencies on Other Teams |
Increases |
Lack of communication, unclear timelines |
Establish clear communication, coordinate schedules |
15-25% reduction |
| Interruptions and Context Switching |
Increases |
Unplanned meetings, urgent requests |
Minimize distractions, dedicate focused work time |
10-15% reduction |
By addressing these challenges effectively, teams can successfully implement these tactics and significantly improve their agile cycle time. Umano offers tools and insights to help teams optimize cycle time, increasing productivity and enhancing business outcomes. Learn how Umano can support your agile goals.
Beyond Speed: Balancing Cycle Time With Quality and Well-being
While a short agile cycle time is desirable, focusing solely on speed can be counterproductive. This section explores the essential balance between rapid delivery and other crucial factors: quality, team well-being, and customer satisfaction. These elements are vital for a sustainable and successful development process.
The Pitfalls of Prioritizing Speed Over Substance
Obsessing over cycle time without considering quality can result in rushed work, increased technical debt, and ultimately, dissatisfied customers. For example, if developers feel pressured to finish tasks quickly, they might neglect thorough testing or proper documentation.
This can lead to bugs in production, which then require additional time and resources to fix. This creates a negative feedback loop that negates any initial time savings from a shorter cycle time.
Creating a Holistic Measurement Framework
Successful organizations recognize that agile cycle time is just one metric among many. They incorporate a broader range of measurements that provide a complete view of performance. This includes:
- Quality indicators (e.g., defect rates)
- Team health metrics (e.g., team happiness scores)
- Customer satisfaction measurements
Here's a table illustrating this balanced approach:
| Metric Category |
Specific Metric |
Target |
| Cycle Time |
Time to complete a user story |
Reduce average cycle time by 15% |
| Quality |
Defect rate per release |
Less than 2% |
| Team Well-being |
Team happiness score |
Maintain an average score of 4 out of 5 |
| Customer Satisfaction |
Customer satisfaction score (CSAT) |
Achieve an average CSAT score of 4.5 out of 5 |
This balanced approach ensures teams focus on delivering high-quality work efficiently and sustainably, not just quickly. For further insights into optimizing cycle time, explore strategies to accelerate software development velocity.
Communicating Cycle Time Improvements Effectively
Simply informing stakeholders that cycle time has decreased is often ineffective. It’s crucial to link improvements to tangible business outcomes. Instead of reporting a 20% cycle time reduction, explain how it enabled releasing new features two weeks ahead of schedule, gaining a competitive market advantage.
Integrating Cycle Time With Broader Performance Measurement
Cycle time should be part of a comprehensive performance measurement system. This involves understanding how cycle time interacts with other metrics. For instance, improving cycle time while seeing a rise in defect rates suggests a process problem.
Analyzing these metrics together allows teams to pinpoint and resolve underlying issues, leading to a more efficient and sustainable delivery process. This fosters continuous improvement and better alignment with business goals. By viewing cycle time within a larger context, organizations can understand its true impact and contribution to overall success. Umano can assist teams in effectively measuring and analyzing these metrics, providing valuable insights for ongoing improvement.
Your Cycle Time Transformation: A Practical Implementation Plan
Transforming your team's agile cycle time takes a structured, actionable plan. This guide, built on proven implementations, offers a step-by-step approach to optimizing your development process. It all begins with understanding your current performance and defining realistic goals.
Establish Your Baseline and Set Improvement Targets
First, measure your current cycle time. This sets your baseline, the starting point for improvement. Track the cycle time for different work items (user stories, bugs, features) across multiple sprints to get a reliable average. After establishing your baseline, define attainable improvement targets. Don't try to cut your cycle time in half immediately. Incremental progress is more sustainable. A 10-15% reduction in the first quarter, for example, is a reasonable objective.
Assemble Your Cycle Time Improvement Team
Create a dedicated team to lead the optimization work. Include members from various roles in your development process: developers, testers, product owners, and even stakeholders. This cross-functional team brings diverse viewpoints and ensures everyone is on board. Their varied perspectives will be essential for identifying bottlenecks and crafting effective solutions.
Design Focused Experiments and Measure Outcomes
With your team assembled, begin with small, targeted experiments to test different improvement approaches. For instance, implement WIP limits for one team and monitor its impact on their cycle time. Alternatively, introduce automated testing with a tool like Selenium for a specific task and measure the time saved. Meticulously measure the results of each experiment. This data-driven method lets you pinpoint the most effective strategies for your team.
Scale Successful Approaches and Sustain Improvements
When an experiment yields positive results, expand it to other teams or projects. Document the process and share the knowledge throughout your organization. Maintaining these improvements long-term is vital. Regularly review your cycle time metrics and revisit your strategies to ensure they remain impactful. This continuous improvement mindset is crucial for lasting change.
Overcoming Resistance and Embedding Optimization in Your Culture
Change can be difficult, and you might encounter resistance to new methods. Communicate openly with your team, explaining the advantages of cycle time optimization and its contribution to overall team success. Address any concerns and provide support to team members adapting to new work styles. Ideally, cycle time optimization should become embedded in your team's culture. Celebrate wins and recognize individual contributions to foster a sense of ownership and continuous improvement.
Optimize your team's performance with Umano. Our platform provides real-time insights into your agile cycle time and other key metrics, helping you identify bottlenecks, improve collaboration, and speed up delivery. Visit Umano today to learn more.