

For those of you who haven’t yet read any of Tomasz Tunguz’ observations and analysis of the burgeoning SaaS technology & investment industry, do. He’s insightful, data-driven and focussed on codifying what ‘better’ looks like in n effort to support the ever fast paced growth of the startup-investment technology ecosystem.
Trawling through his repository of articles for gems as I sometimes do, a number of unrelated posts struck my attention as being relevant for our mission at Umano.
Engineering is core and matters.
In How should you allocate your Startup’s OpEx between Sales and Engineering?, Tomasz reviews the percentage of revenue SaaS companies spend on sales vs engineering across their lifecycle of starting up to growth. His analysis shows that engineering can equate to 40% of a company’s headcount and operating expense in the early years of establishing. This on average dilutes to approximately 30% as companies grow to $50-100m ARR.
Gross margin matters.
In ‘The 10 most Important Metrics in a Startup’s FInancial Statements’, Thomas advocates for Gross margin being more important than revenue as a financial metric.
Gross margin = (Revenue – Cost of Goods Sold) / Revenue
Sales and marketing matter.
In Redpoint SaaS Startup Key Metrics Template I’m struck by how many functions like sales and marketing had around 30 metrics relevant for ‘running your company’. These provide invaluable insights into the efficiency, mechanics and key revenue drivers for a company’s profitability.
So why only track Engineering outputs?
And so, when a subsequent post adds Engineering Metrics to this template, I’m equally surprised to see only three metrics as the priority data points recommended to provide insight into the effectiveness of the engineering organisation. Particularly so when these three most relevant relate to application serviceability-
Reliability – percent of application requests that load. 1 minus reliability is the percentage downtime. This measures the durability of the application.
Availability – percent of application requests that load within a certain latency. 99% uptime means for 99% of seconds within a month, the application responded to requests within 5 seconds. Each company should define the acceptable latency. This measures the responsiveness of the application.
Incident rate – support case count divided by active users. This is a proxy for product quality. If the support case count declines on a per user basis, this indicates product quality broadly defined has improved.
Quote: “New engineering metrics to provide a sense of engineering efforts for boards and executives to discuss. I wish there was a way to get a sense of engineering cadence or productivity (similar to AE quote attainment), but that remains elusive.”
A recap: let’s join the dots on this picture.
So, engineering costs between 30-40% of a company’s expense, can have a major impact on a company’s gross margin being a primary financial driver, and yet these are the three most relevant metrics nominated worthy of providing insight into this function to provide “a sense of engineering efforts for boards and executives to discuss”.
With all due respect, I don’t buy it.
Sorry engineers, but I think this picture does a disservice to the importance of the engineering organisation. These chosen three present a blindfolded view into truly understanding the role your engineering organisation plays in delighting customers and driving company profitability.
Clearly, Tomasz doesn’t speak for all. I’m sure that many engineering leaders are running people, practices and products as a finely tuned machine with sophisticated dashboards of real time insights into their operation. There are however a surprising number of engineering leaders I speak to that are still missing out on the power and confidence that a broader range of insights into their ‘team machine’ can provide. Keeping a low profile certainly has its advantages, but these three metrics don’t do any justice in telling a fact-based narrative of the importance, impact and progress of engineering on your company’s success. We’ll take our rightful place at the ‘round table’ when we’re transparent about the critical inputs and outputs that deliver success outcomes for our customers whilst under our watch.
Time to step into your engineering prowess!
For those that haven’t yet, it’s time to broaden our horizons. Get on the front foot and own your insights from a broader set of metrics. This will help you get to next-level clarity when influencing, aligning and focusing stakeholders on what’s going well, and where improvements to your organisation’s effectiveness can be made.
I make a case that your teams, peers, leaders and Board have a vested interest in at least some of the following insights about the effectiveness of your engineering organisation.
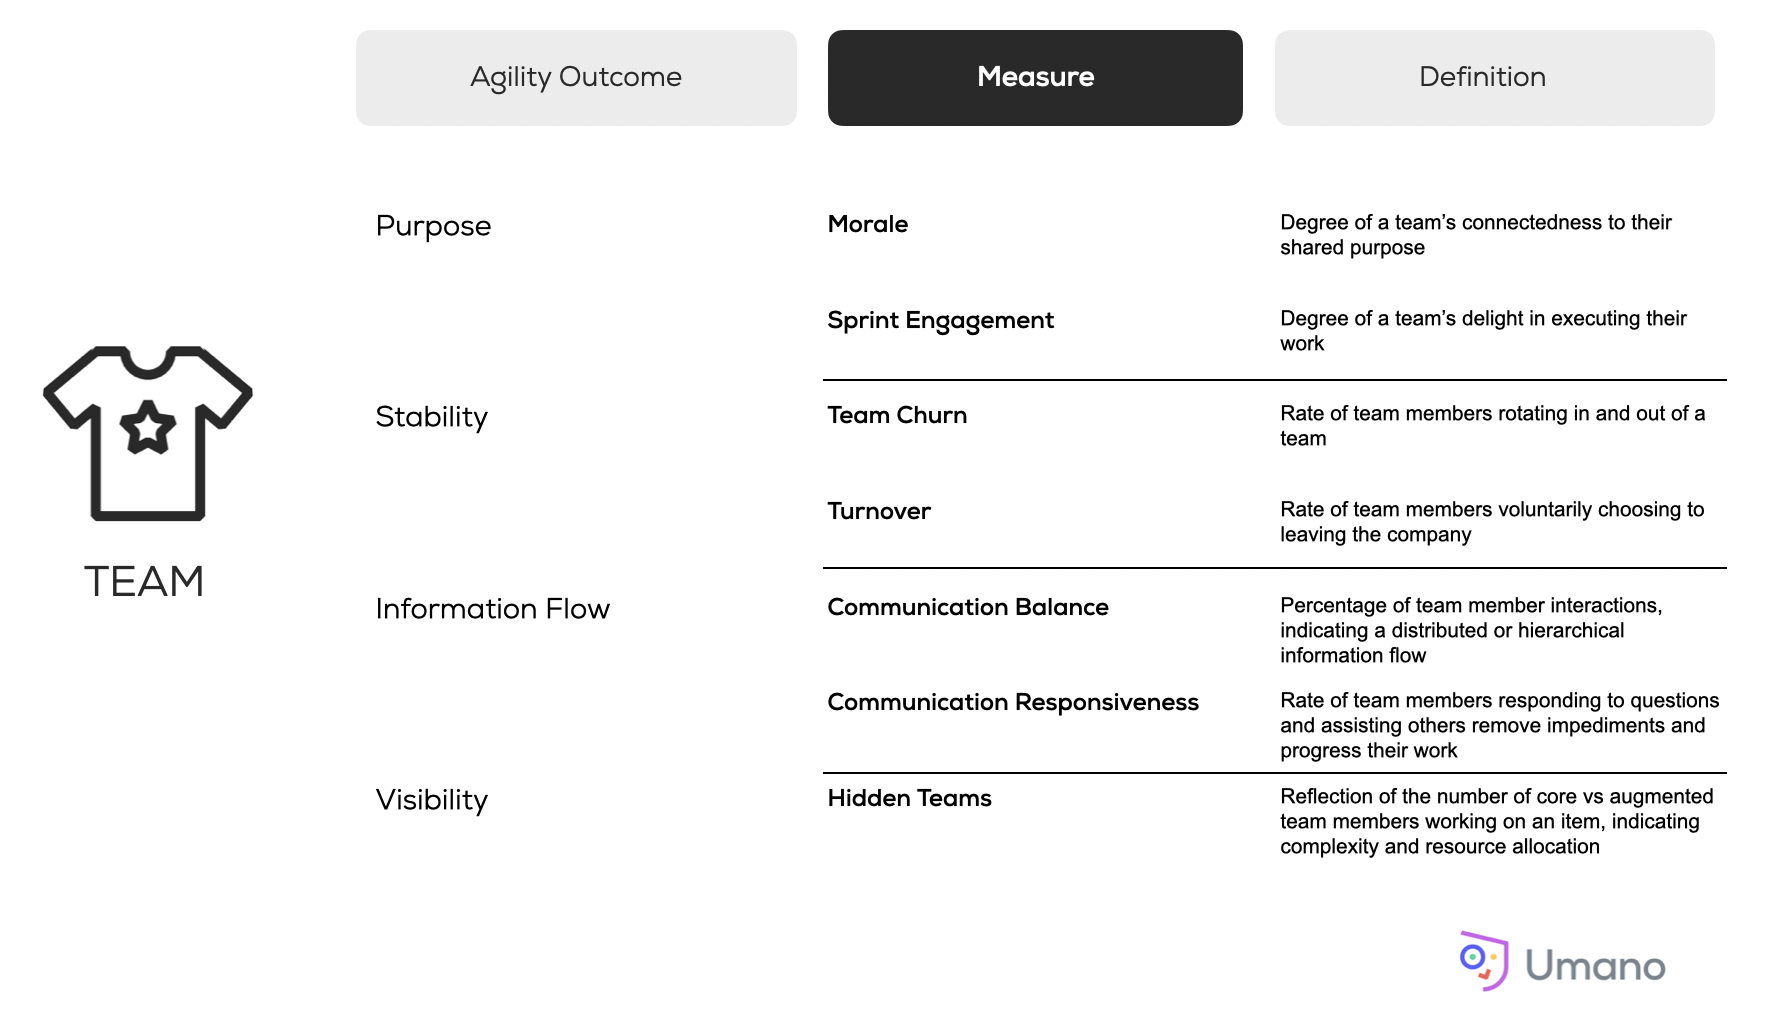
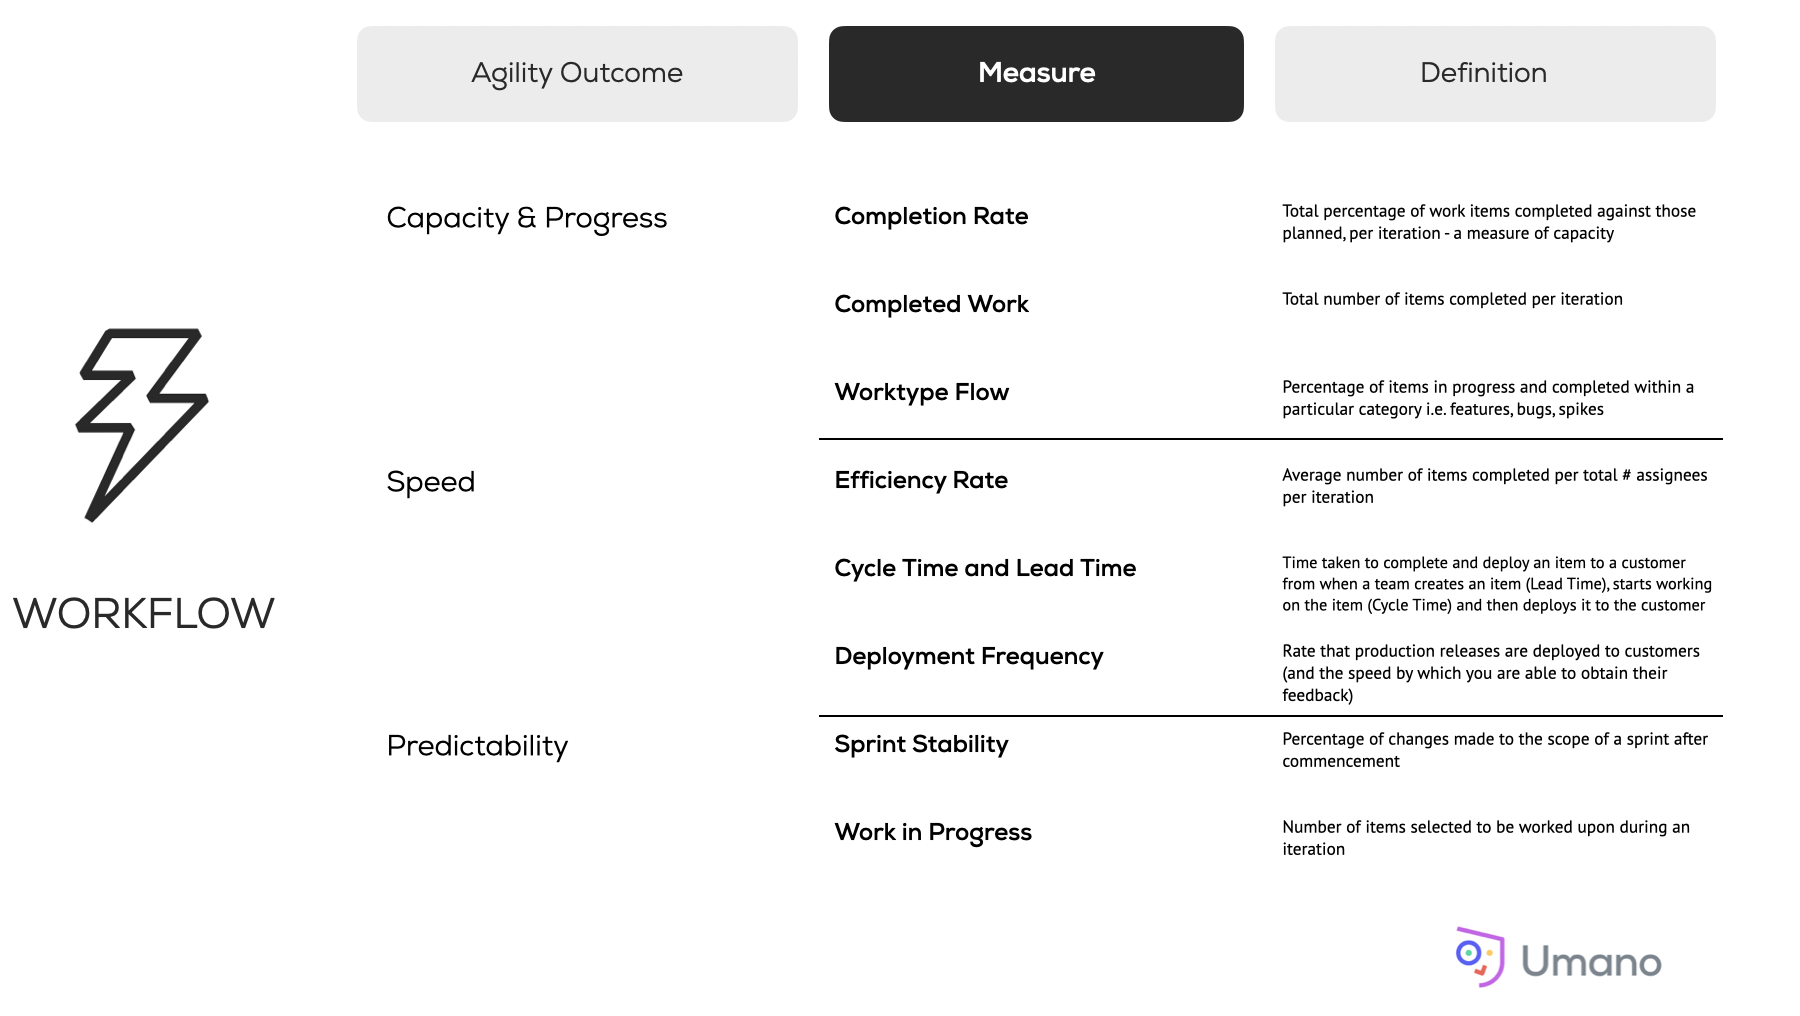
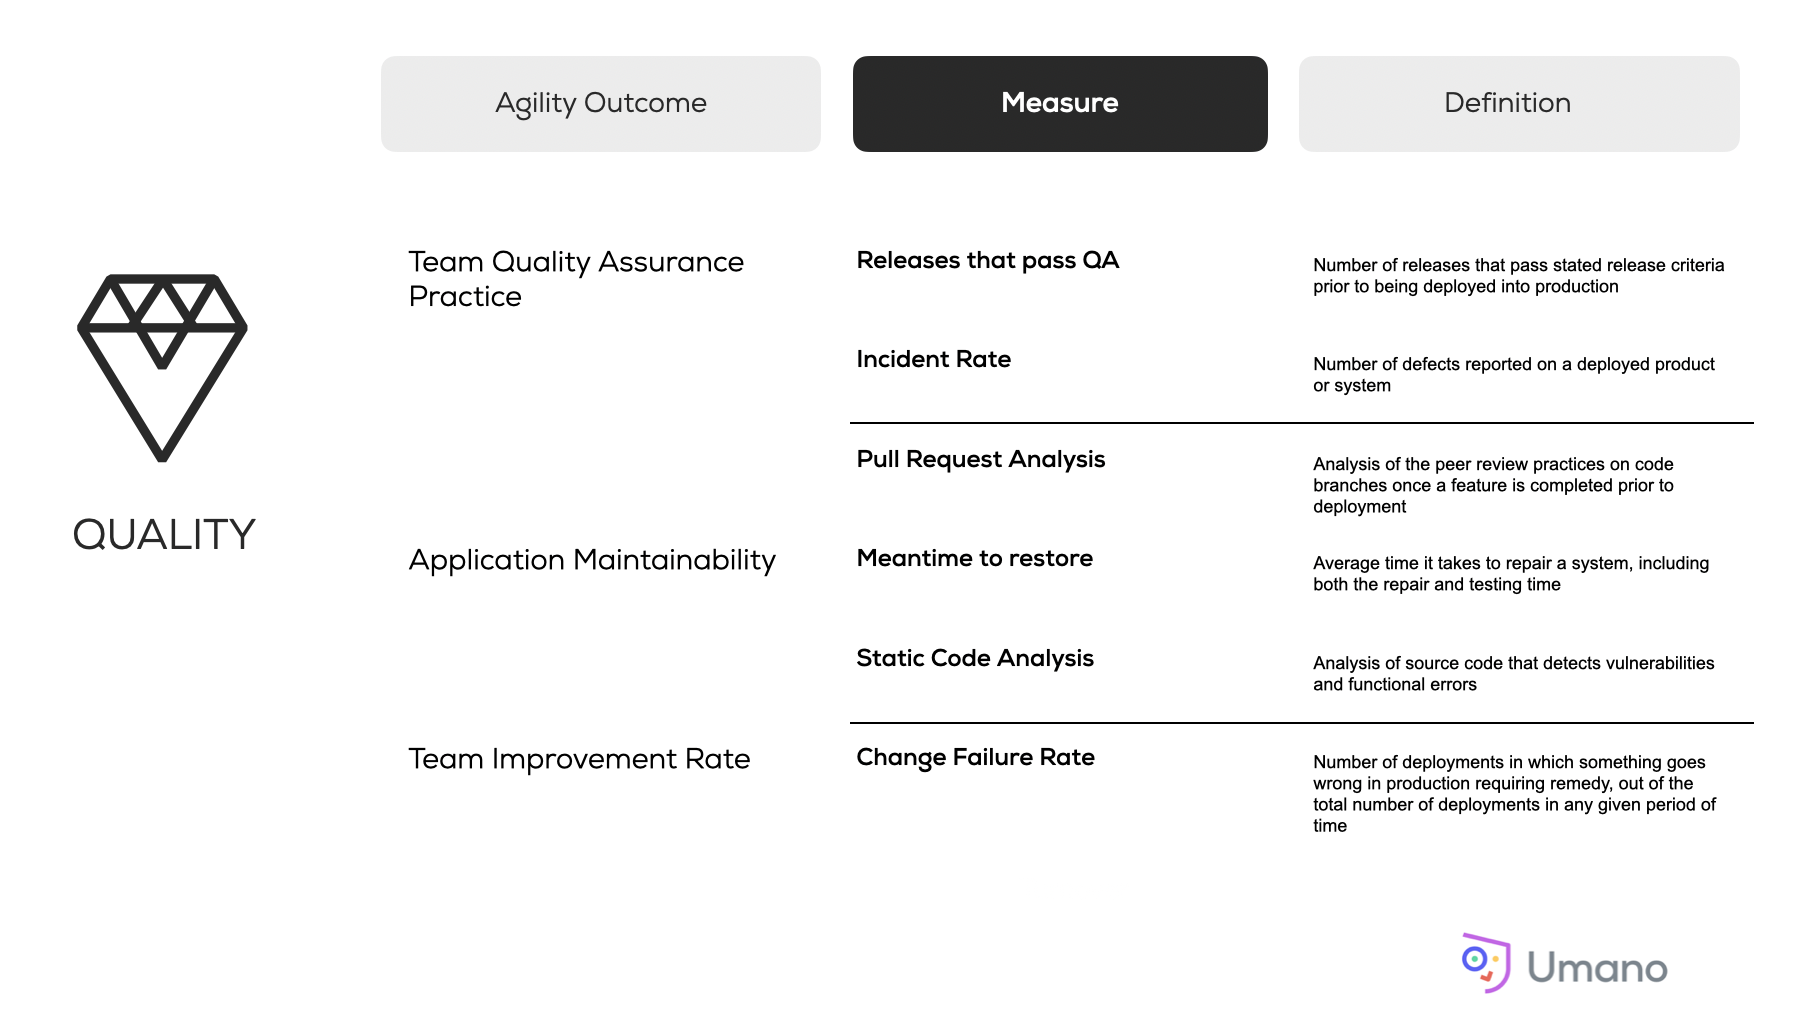
So what agility outcomes are you trying to improve? What case do you need to make to align your stakeholders?
Armed with the facts, a broader set of engineering metrics will paint a strong and confident picture of the engineering organisation’s efficiency, effectiveness and agility outcomes today, and act as your guardrails as you scale into the future. Step into the light; the facts will set you free!
Umano is on a mission to support agile delivery teams perform at their best through automated metrics, reporting and insights.
Sign up here to access your complimentary Umano account and see how your team’s agile sprint practices are tracking.
Shoutout to Alexey Berdnikov for the hero image.